
Layers
Regrid curates an ever-growing number of layers, which contain various data (flood zones, building footprints, building dimensions etc) that you can turn on and off from within the Layers menu (bottom right). Some layers are visual overlays (like the FEMA flood hazard layer, pictured below), while others like the "Labels" options allow you to see data like owner "floated" on top of the map.
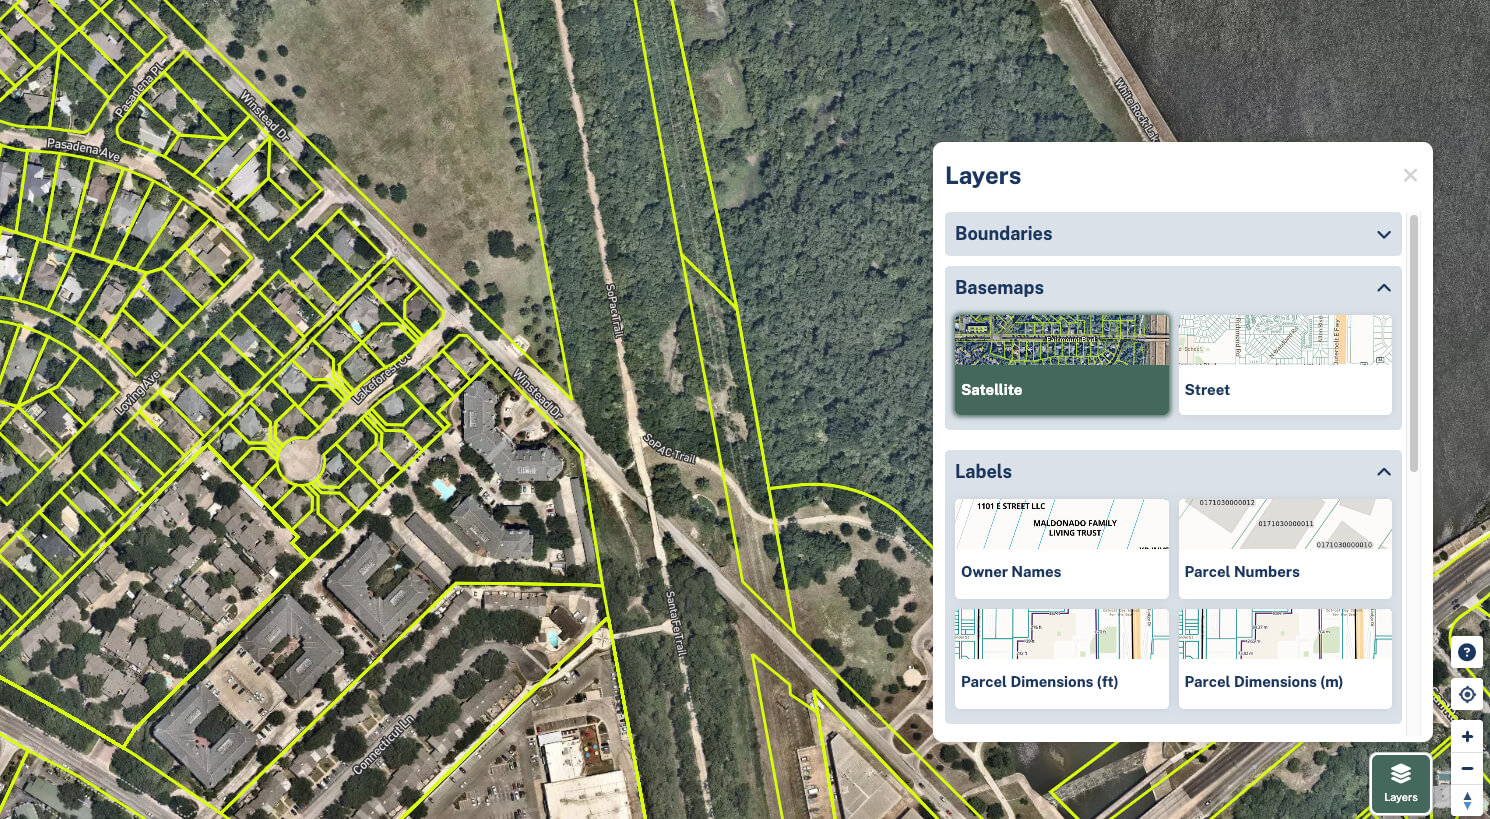
Click on a layer to add it to your screen, and click it again to remove it.
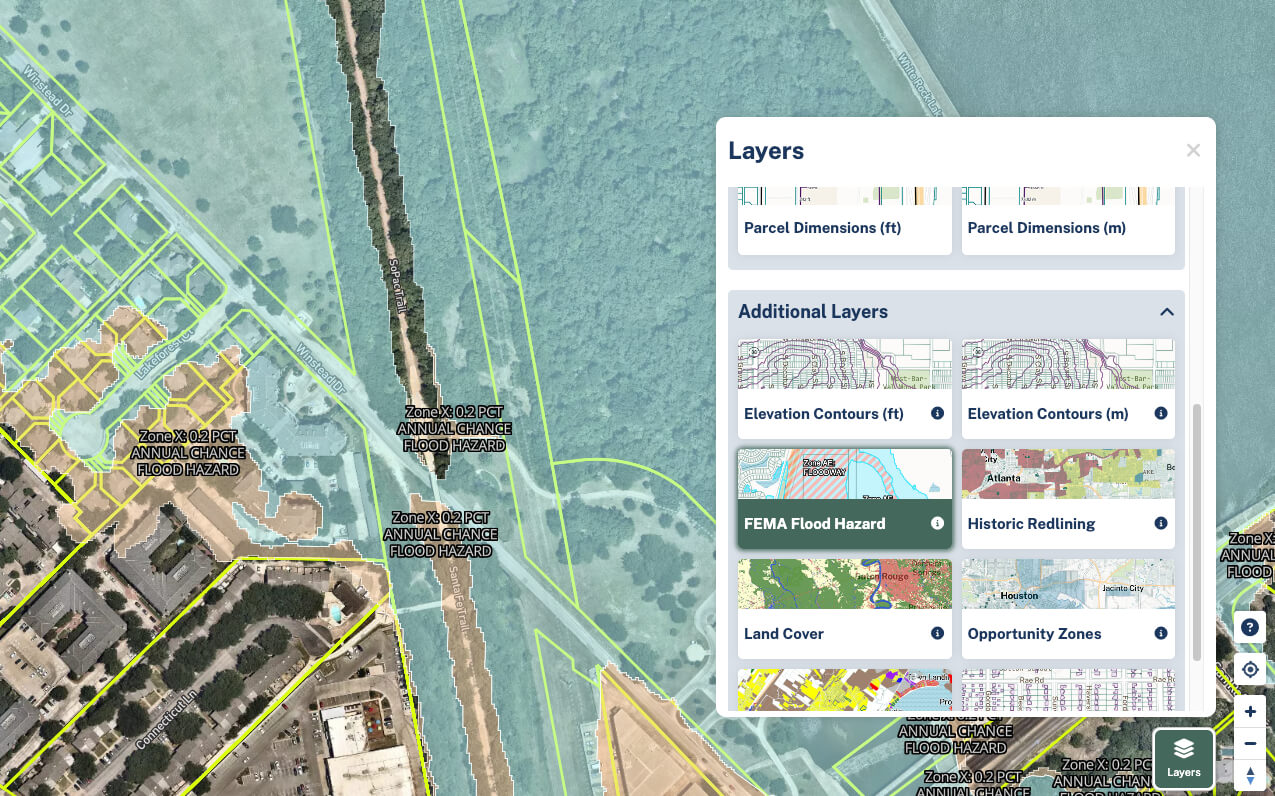
Descriptions of each layer can be found by moving your mouse over the 'i' or Info buttons.
Floated Fields
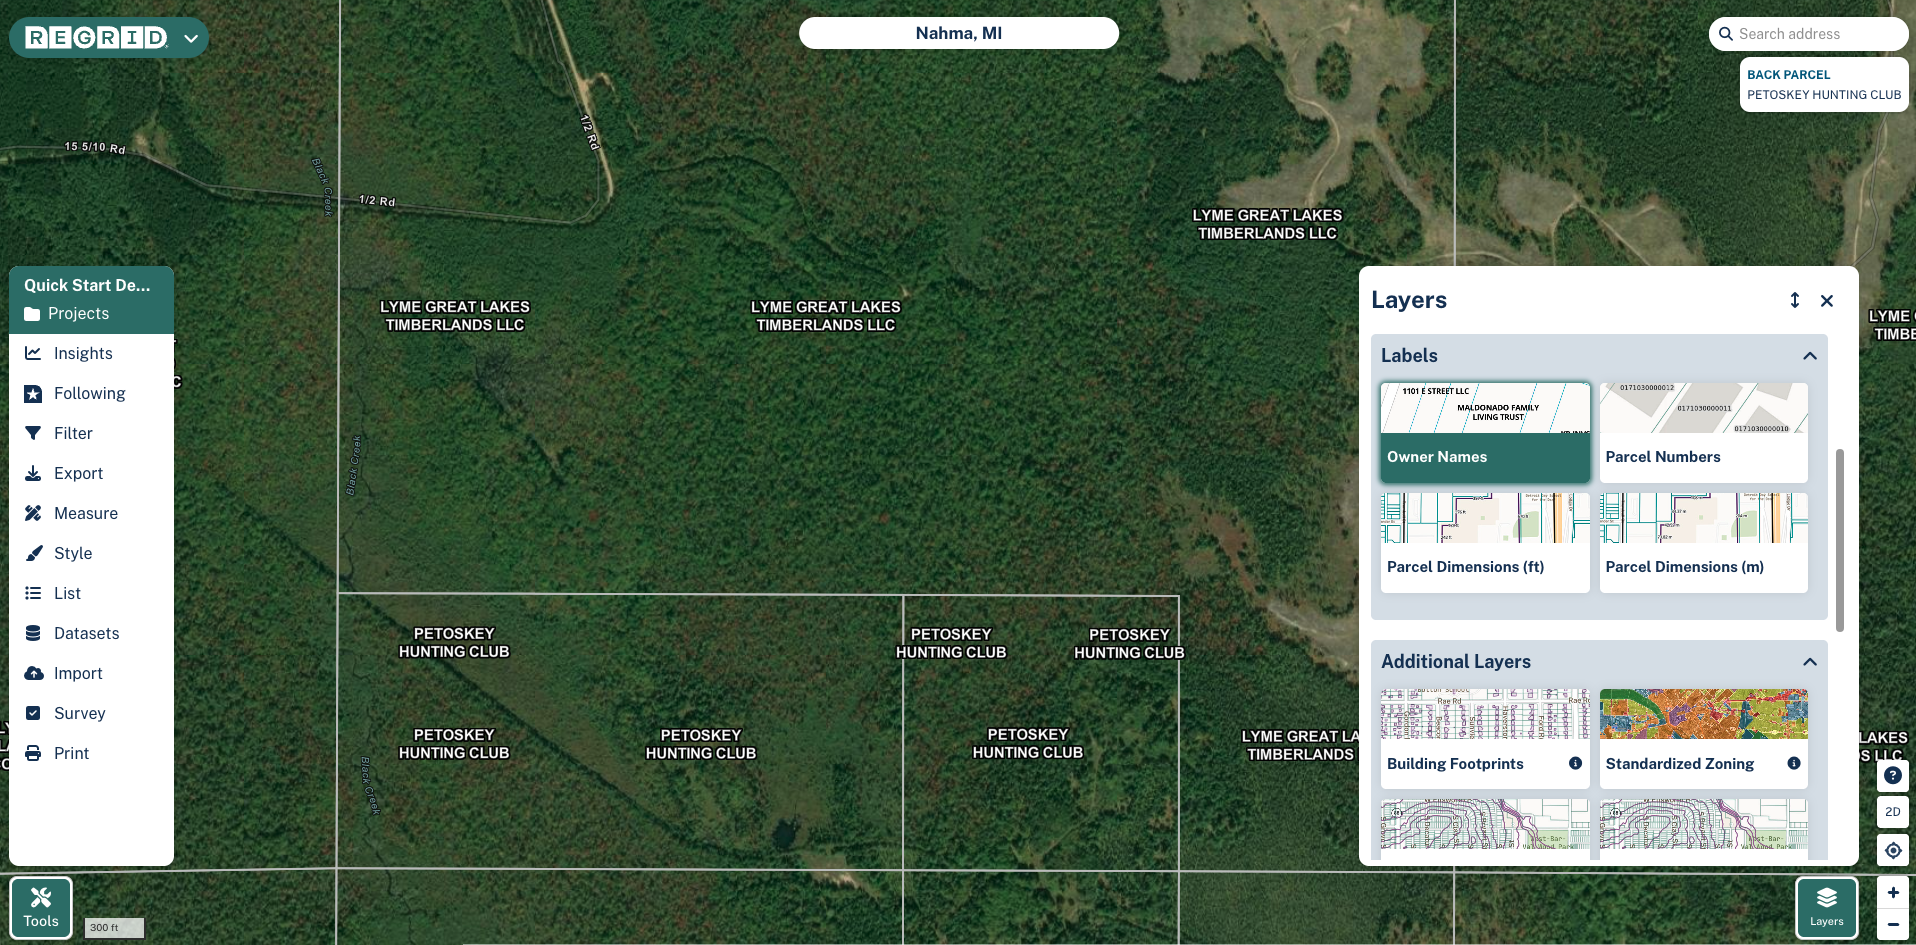
We offer four fields that you can "float" over the map.
- Owner name
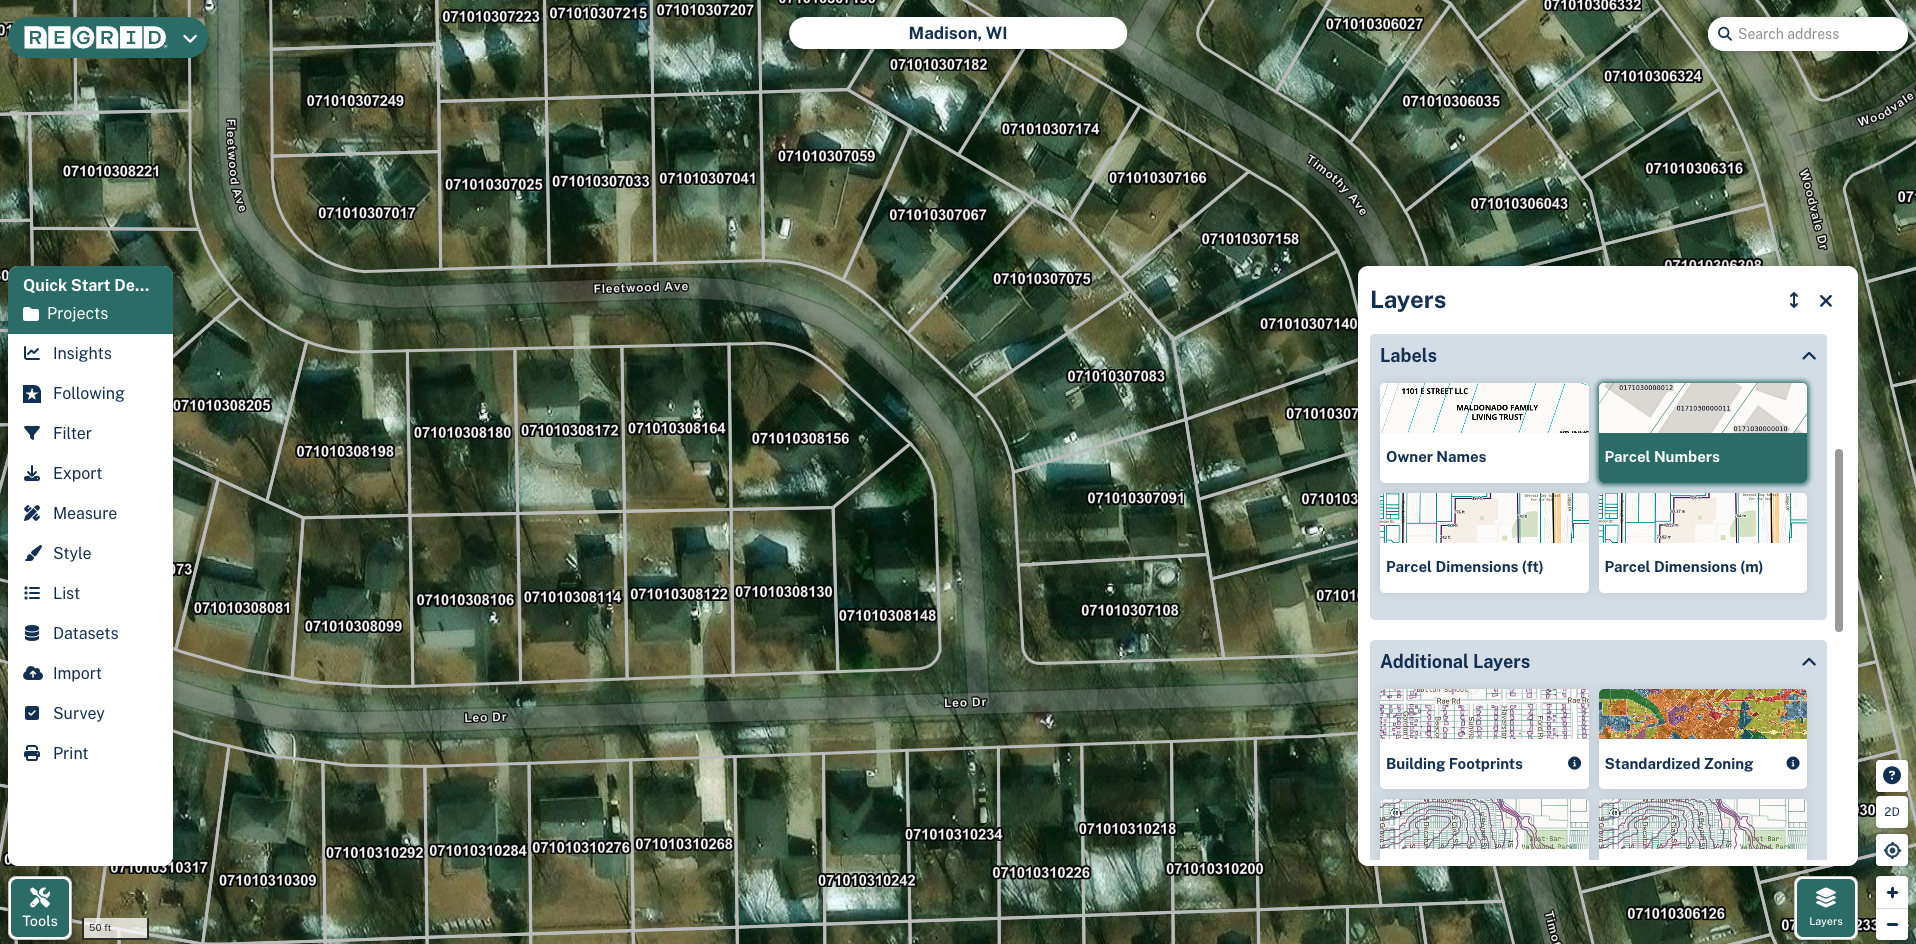
- Parcel number
- Parcel dimensions in feet or meters. Note: to see these dimensions, you'll need to click on a parcel.
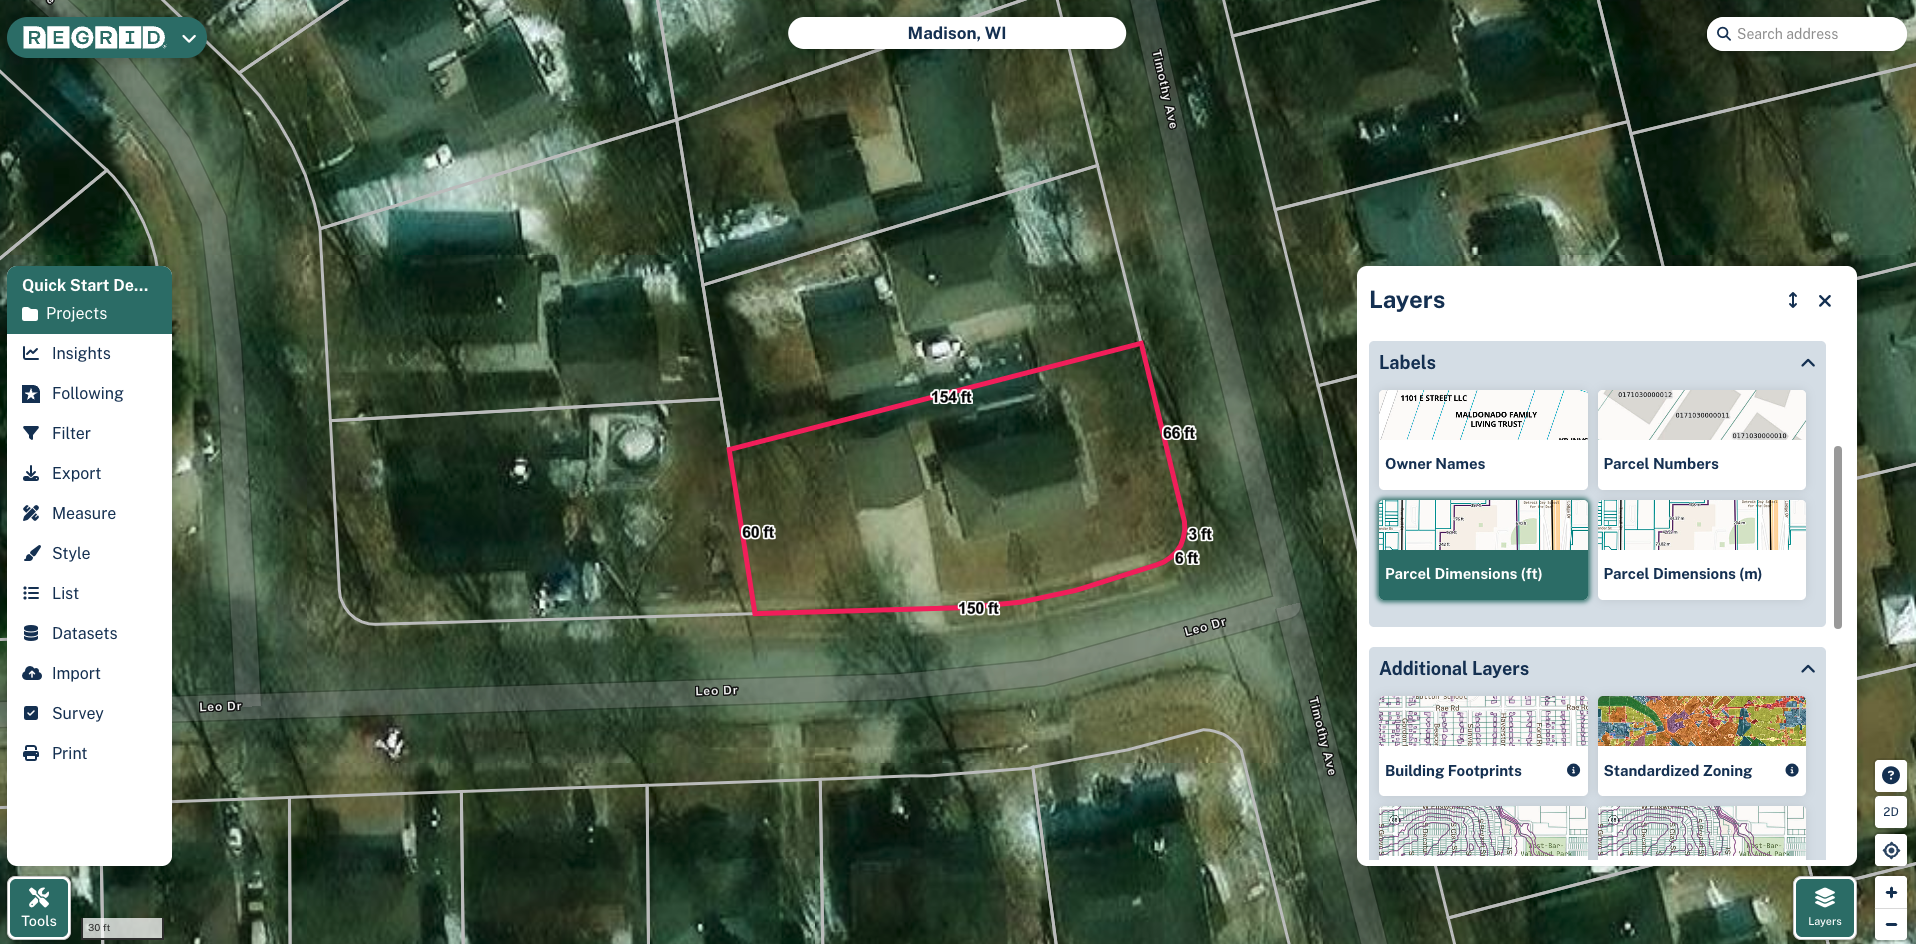
Additional Layers (Overlays)
We offer the following layers as overlays. When turned on, these layers go on top of the street or satellite basemap.
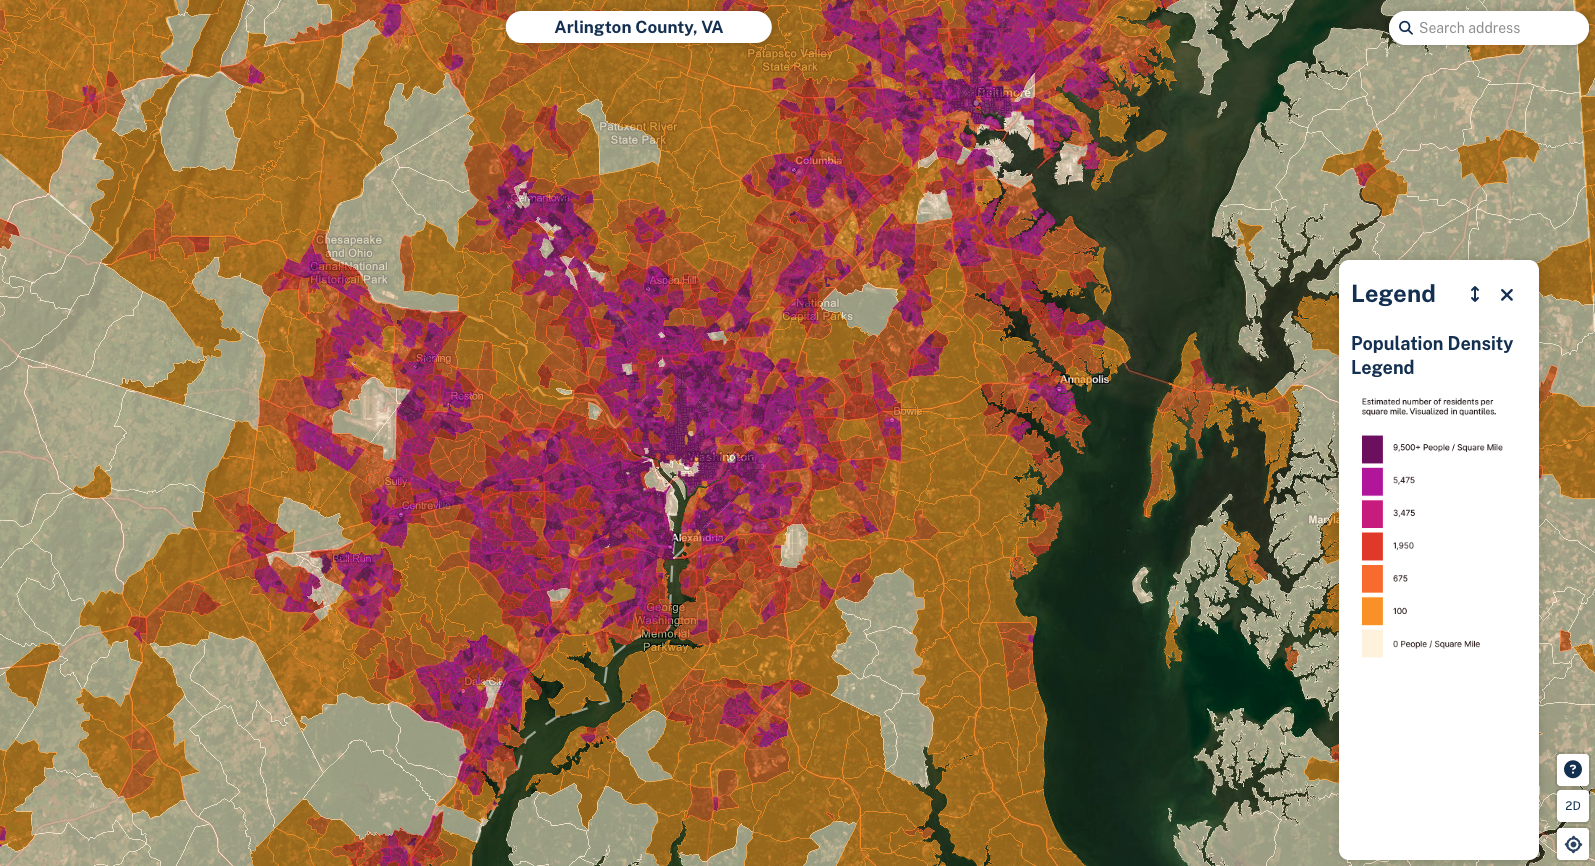
- Building Footprints
- Standardized Zoning
- Elevation Contours (feet or meters)
- FEMA Flood Hazard
- Wetlands
- Population Density
- Population Growth Forecast (5Y)
- Housing Affordability Index
- Opportunity Zones
- Land Cover
- Historic Redlining
- Public Lands
Adding multiple layers to the map at once
We try to make it as easy as possible for users to be able to toggle layers on and off. There are some basic rules in place to prevent users from combining certain layers, primarily in cases when the combined display would be too confusing or "busy":
- You can have either owner name or parcel number "floated" on the map, but not both
- You can only have one elevation layer (either feet or meters) on at once
- Only one of the layers found in the "Additional layers" section can be on at a time, with the exception of building footprints which can be used in combination with the other layers.
Updated 7 months ago