View Data as a List
About List view
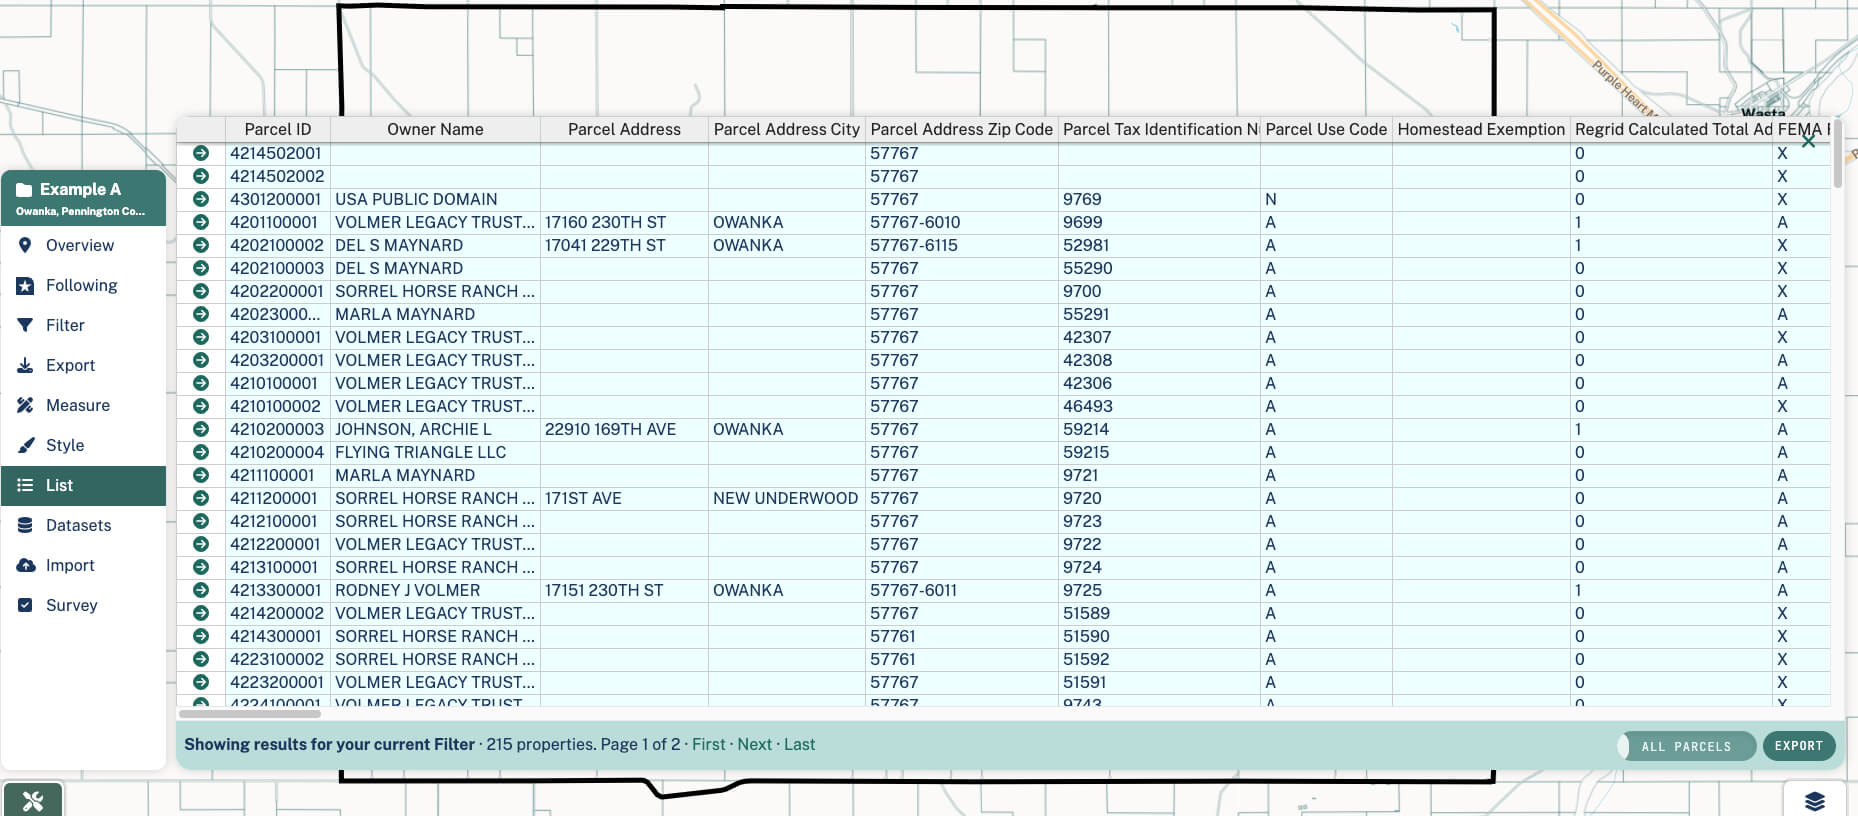
All the data that you see in the Regrid Property App is presented spatially (ie on the map) by default, but we also offer a way to see that same data formatted as a spreadsheet. If you start a fresh Project and click "List" on the left hand sidebar, you'll see a spreadsheet view of all the property data we have, within whatever boundary you currently have selected on the map.

You can scroll to the right to see additional columns of data, and you can click the little arrow icon in any given row to 'jump' to that specific parcel on the map.
List view when you have your own data attached
The data you add to a Project, either through surveying properties or importing datasets, all gets attached to our parcel data behind the scenes, and appended as columns when you look at it in List view. Each dataset attached to a Project gets its own color in List view to make it a little easier to distinguish our data from yours.
You'll notice in the screenshot above that there is a toggle reading 'Only My Data' down in the bottom right. This is telling you that you're seeing only properties within the chosen boundary which also have your data attached. Example: if you're looking at an area containing 100 properties total, but you've posted survey data to just 20 of them, with the 'Only My Data' toggle on, you will only see 20 properties in your List.
If you would like to see ALL properties in the area, whether they have your data attached or not, click the toggle again: you will see it switch to read "All Data".
Exporting Data from the List
You can export data from the List by clicking the "Export" button down at the bottom right. This will take you to our Export pane, where you can download data in a variety of formats: our handy Export support page can provide additional detail and instructions.
Please note, Starter users will not be able to download any data. This option is available for Pro users and up.
Interested in downloading bulk data? Learn more here.
Export Tutorial Video