Style/Color-Code Data
This feature is only available with a paid Regrid account (Pro or Team). Click here to upgrade your account.
You can use the Style tool to customize the look and feel of properties within any Project you have. Style rules will apply to your entire Project, and you can change your Styles at any time.
Customizing the default parcel styling
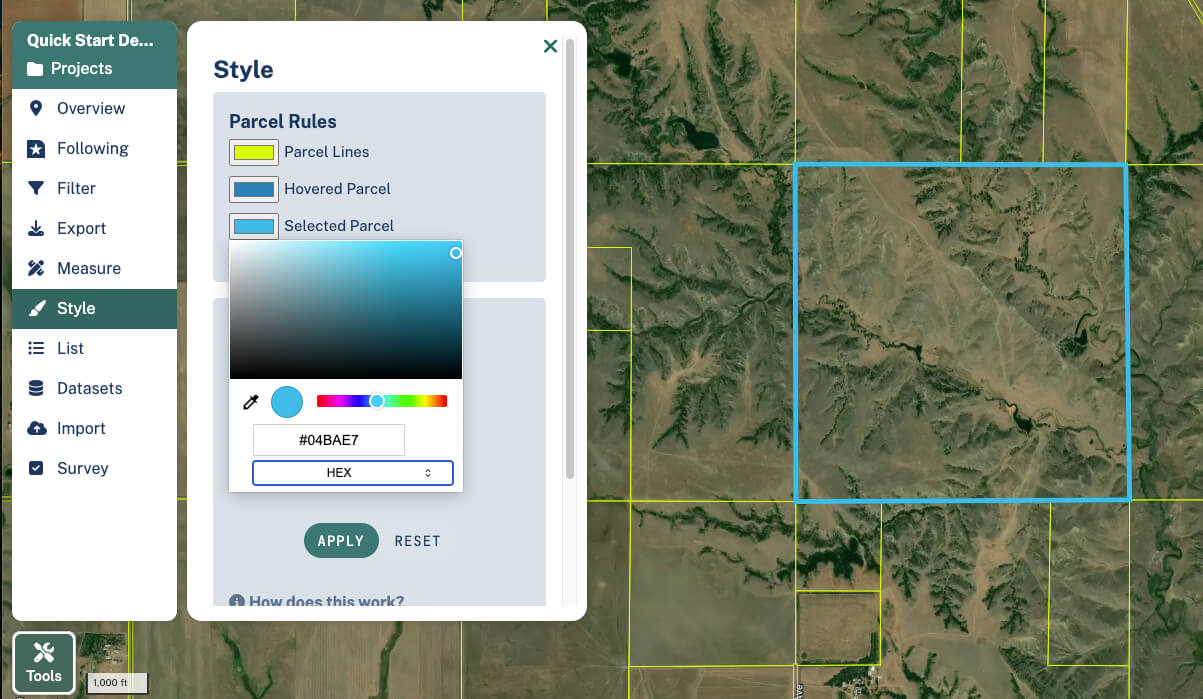
When you first view the map in Regrid, you're seeing a Layer (ie a Street or Satellite basemap - see Layers article for more on options with this), and then on top of it sits our parcel layer which shows you property boundaries. We've set default styles for the parcel layer - but you can customize these to whatever works best for you. There are three parts to this: the parcel layer itself (aka the color of all properties you see), the hovered parcel (what color the property turns when you put your cursor over it), and the selected parcel (what color the property turns when you click on it).
To change any of these, click the Style tab in the left toolbar, then simply click the rectangle of color next to the desired part; this will open up a color picker where you can either choose a color manually, or input a hex code if you have one in mind.
Setting a Style rule
The other way you can customize what you see on the map is by setting style rules, which turn properties your chosen color when it fits a certain criteria (for example, if you want to make all parcels owned by ACME CONSULTING red). To create a style rule:
-
Open the project (or create a new one) that you'll be working in. Use the search bar or the breacrumbs up top to navigate to your area of interest, if you're not already there.
-
Click 'Style' on the left hand toolbar, then 'Add a Rule' to start setting your first style.
-
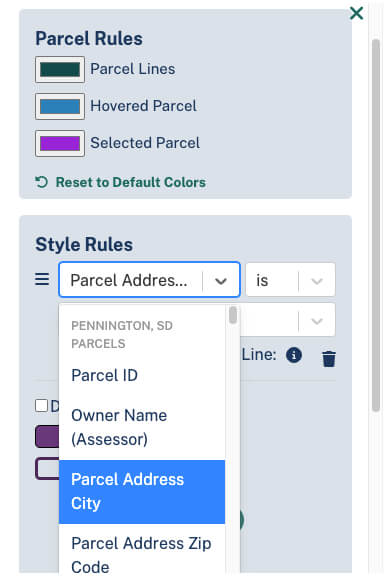
Click the dropdowns to choose your criteria. The first box (pictured below) is where you choose your data column (ie "Owner", or "Land Use", etc); the second you can choose your operator ("IS", "IS NOT", or "HAS ANY VALUE"); and the third, you can choose a specific value within the data column (ie "City of San Francisco", or "Residential", etc).
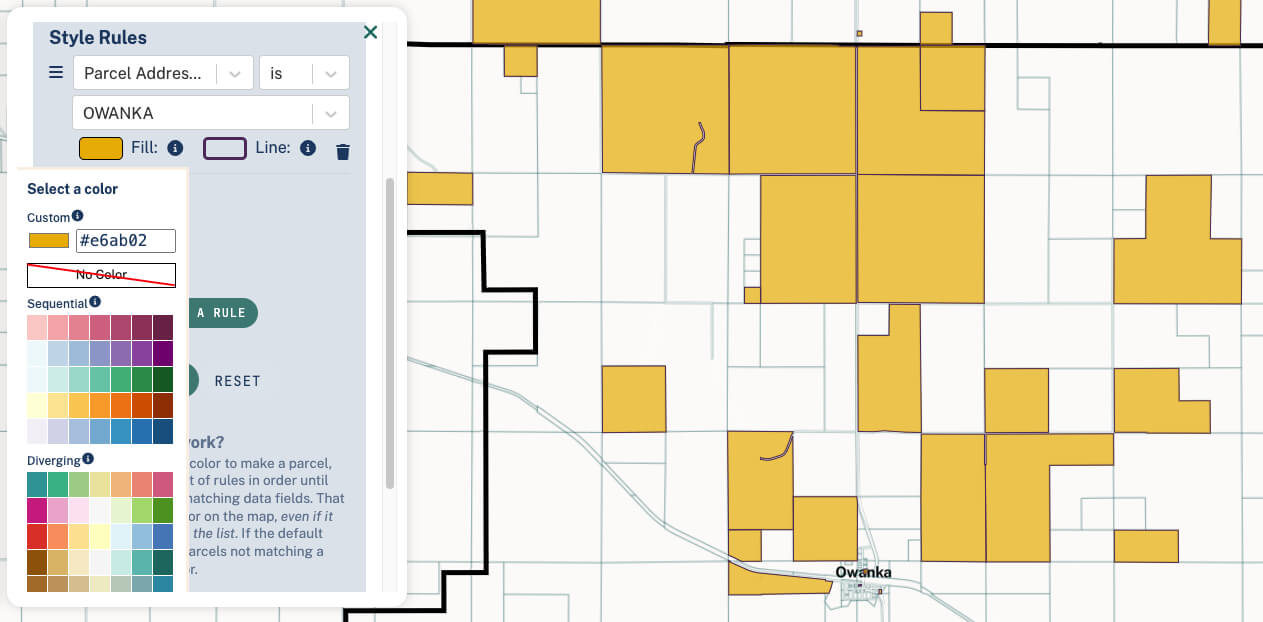
Each style rule you set can have a fill and a line color; you can also set these to 'none' if you choose. Click the line and fill boxes to set these as you wish.
- When you've got these set, click "Apply". You should see the relevant parcels color on the map.
- You can repeat this process for as many style rules as you like.
Tips on working with the Style tool
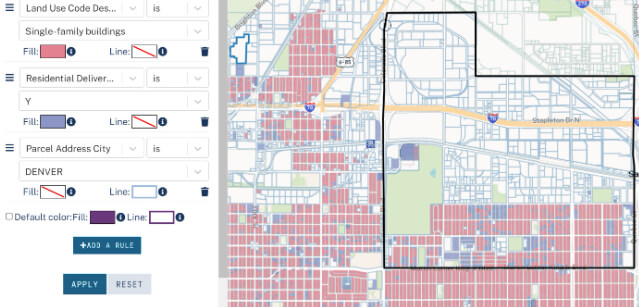
Style rules are matched to parcels sequentially based on the top to bottom order in your Project's Style area. That means if you create a set of Style rules that includes two color codes, both of which match parcels on your Project, the parcels will be highlighted ONLY by the color rule you defined first. Any parcel with imported data not covered by a Style rule will show up in the "default" color, which you can also designate.
For example:
Say you have a parcel with the address 555 Fake Street that has two data fields:
- Condition: Good
- Occupancy: Vacant
If you go to the Style tab and set Condition = Good to color parcels in Green, and then set another rule to color Occupancy = Vacant parcels in Red, then the 555 Fake Street parcel will ONLY color in Green – it matches both rules, but the Condition rule is set first, so that's the color that will be applied.
If you plan to share your Project (See Share Your Project), you may want to check that your column headers and cell contents are easily comprehensible before importing the data.
If you want to search your data in a way that will show all properties that match BOTH Condition = Good AND Occupancy = Vacant, then skip to the Filter tool to learn about searching multiple criteria at once.