Using the Tileserver API
The Regrid Tileserver provides parcel tiles in raster and vector formats for use with web mapping tools like Mapbox GL and Leaflet. This service is available to clients with tileserver API subscription. This can also be added on to a Self Serve API Subscription or Enterprise License.
Tile layers offer a powerful and flexible tool for creating fast, scalable, and customizable web maps that can be easily integrated into a wide range of web and mobile applications.
A tile layer is a fundamental component of a map style that displays geographic data as a set of tiled images, or "tiles". A tile layer can include various types of data, including raster and vector data, and it can be customized with different styles, colors, and labels.
Benefits of a tile layer:
- Improved Performance: By breaking the map into a grid of smaller tiles, web mapping applications can load only the necessary tiles needed for the current view, rather than having to load the entire map at once. This reduces the amount of data that needs to be transferred, resulting in faster load times and better overall performance.
- Scalability: Tile layers can be easily scaled to accommodate different zoom levels and screen sizes, making them ideal for use in web mapping applications that need to work across a range of devices and screen resolutions.
- Customization: Tile layers can be customized with different styles, colors, and labels to create unique and visually appealing maps. This allows developers to create maps that match the look and feel of their application, and provides users with a more personalized experience.
- Interactivity: Tile layers can be used to create interactive maps that allow users to zoom in and out, pan around the map, and click on individual features to access additional information. This makes tile layers ideal for use in web mapping applications that require a high degree of interactivity and user engagement.
Please direct feedback and questions to help@regrid.com.
Raster versus Vector
Raster tiles are image-based tiles that consist of a grid of pre-rendered images that are stitched together to form a complete map. Each tile represents a specific geographic area at a particular zoom level, and the images are often generated using aerial or satellite imagery, or from other sources like scanned maps. Raster tiles are typically used for displaying detailed imagery or thematic maps, like a heat map or an elevation map.
Vector tiles, on the other hand, are data-based tiles that consist of vector data, such as points, lines, and polygons, that are served as discrete features rather than images. Each tile contains a set of vector data that represents a specific geographic area at a particular zoom level. Vector tiles can be generated from a variety of sources, including GIS data, GPS data, or other sources, and are typically used for displaying maps with complex data sets, such as road networks or building footprints.
The main difference between raster and vector tiles is that raster tiles are image-based and therefore have a fixed resolution, while vector tiles are data-based and can be scaled without losing quality. This makes vector tiles more versatile and adaptable to different screen sizes and resolutions, as well as more efficient for rendering maps on the fly. Additionally, vector tiles can be customized with styles and labels, allowing for greater control over the look and feel of the map. However, raster tiles can be more suitable for displaying high-resolution imagery or specialized maps that require a large amount of detail.
Tileserver API
Endpoint
All tileserver requests will be to the https://tiles.regrid.com domain, with the paths described below per request.
Authentication and tokens
All requests to the tileserver API must include a token parameter. If you have a Parcel or Tileserver API subscription, you can find your token in the API section after logging into your account at regrid.com.
A single Regrid API token can be used for our Parcel API and our Tileserver API, but separate tokens for each is recommended.
Parcel tiles
Regrid provides a styleable, seamless, nationwide layer of parcel outlines in vector (MVT) and raster (PNG) formats.
TileJSON
TileJSON is a format used to describe the metadata of a tileset, including information like the URL template for the tileset, the maximum zoom level, and attribution data. The TileJSON specification is maintained by Mapbox, and is designed to provide a standardized way of describing tilesets that can be used by different mapping libraries and tools.
We serve TileJSON-formatted metadata for generic parcel tiles which is used to get the full url to either our raster or vector tile layers:
- Raster tiles:
/api/v1/parcels?token=<token> - Vector tiles:
/api/v1/parcels?token=<token>&format=mvt
Our TileJSON includes the required "tiles" endpoint array. The url(s) in that key are the layer urls to use in your application. We put our vector tile endpoint in each response with the key "vector".
We also include a "grid" endpoint for UTF grids (only used with Leaflet-based raster maps).
Tiles
The base tile path is /api/v1/parcels/{z}/{x}/{y}.format. Supported formats are mvt and png. PNG tiles are provided with a default Regrid style.
Tiles are available as far out as zoom level 10 and as close in as zoom level 21. Tiles outside of that range will return a 200 OK response, but no content.
Tiles of png format can have @2x appended to the final y coordinate to indicate a tile size of 512px vs the default 256px. For example, https://tiles.regrid.com/api/v1/parcels/15/8828/12121@2x.png?token=<token>.
Using tiles in your app
Leaflet raster layer example
In Leaflet, a tile layer is a layer that displays map tiles using pre-rendered imagery or vector data. A tile layer in Leaflet is made up of multiple square tiles that are arranged in a grid to cover the entire map area. Leaflet tile layers can be customized with different styles, colors, and labels to provide a unique look and feel for maps. This can be done using CSS, JavaScript, or other styling techniques. One of the key advantages of using Leaflet tile layers is that they are lightweight and can be easily integrated into web applications, resulting in fast and responsive maps even on slower connections.
To add raster tiles to a Leaflet map:
L.tileLayer(
  'https://tiles.regrid.com/api/v1/parcels/{z}/{x}/{y}.png?token=<token>'
).addTo(map)
Leaflet vector layer plug-ins
Leaflet 0.7 and 1.x support mapbox vector tiles via plugins.
We do not currently have any feedback or experience with this solution so can not offer any advice.
Mapbox GL JS vector example
A Mapbox tile layer is made up of multiple square tiles, which are arranged in a grid to cover the entire map area. Each tile represents a small portion of the map and includes pre-rendered imagery or vector data that is styled and labeled according to the chosen map style.
<html>
  <head>
    <script
    src="https://code.jquery.com/jquery-3.4.1.min.js"
    integrity="sha256-CSXorXvZcTkaix6Yvo6HppcZGetbYMGWSFlBw8HfCJo="
    crossorigin="anonymous"></script>
    <script src='https://api.tiles.mapbox.com/mapbox-gl-js/v1.2.1/mapbox-gl.js'></script>
    <link href='https://api.tiles.mapbox.com/mapbox-gl-js/v1.2.1/mapbox-gl.css' rel='stylesheet' />
    <style>
      body, #map {
        height: 100vh;
        width: 100vw;
      }
    </style>
  </head>

  <body>
    <div id="map"></div>

    <script>
      var url = 'https://tiles.regrid.com'
      mapboxgl.accessToken = 'pk.'; // Insert your Mapbox token here
      var map = new mapboxgl.Map({
        container: 'map',
        style: 'mapbox://styles/mapbox/light-v9',
        zoom: 15,
        center: [-83.139981, 42.398763],
        showTileBoundaries: true
      });
      map.showTileBoundaries = true;

      map.on('load', function () {
        // Create a parcel layer
        var parcelCreate = $.ajax({
          url: url + '/api/v1/parcels?format=mvt&token=',
          type: 'GET',
          contentType: 'application/json',
          dataType: 'json'
        });
        parcelCreate.fail(function(jqXHR, textStatus, errorThrown) {
          console.log('Error getting parcel layer', jqXHR, textStatus, errorThrown);
        });

        $.when(parcelCreate).then(setup);

        function setup(layerData) {
          var data = layerData;
          console.log('Got parcel layer', layerData);

          // Register the parcel source using the tile URL we just got
          map.addSource(data.id, {
            type: 'vector',
            tiles: data.tiles
          });

          // Add basic parcel outlines
          map.addLayer({
            'id': 'parcels',
            'type': 'line',
            'source': data.id,
            'source-layer': data.id,
            'minzoom': 13,
            'maxzoom': 20,
            layout: {
              visibility: 'visible'
            },
            'paint': {
              'line-color': '#649d8d'
            }
          });
        };
      });
    </script>
  </body>
</html>
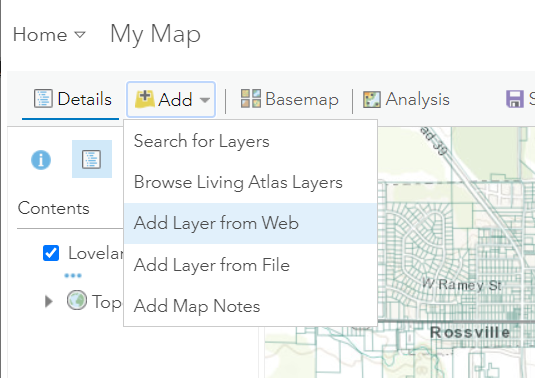
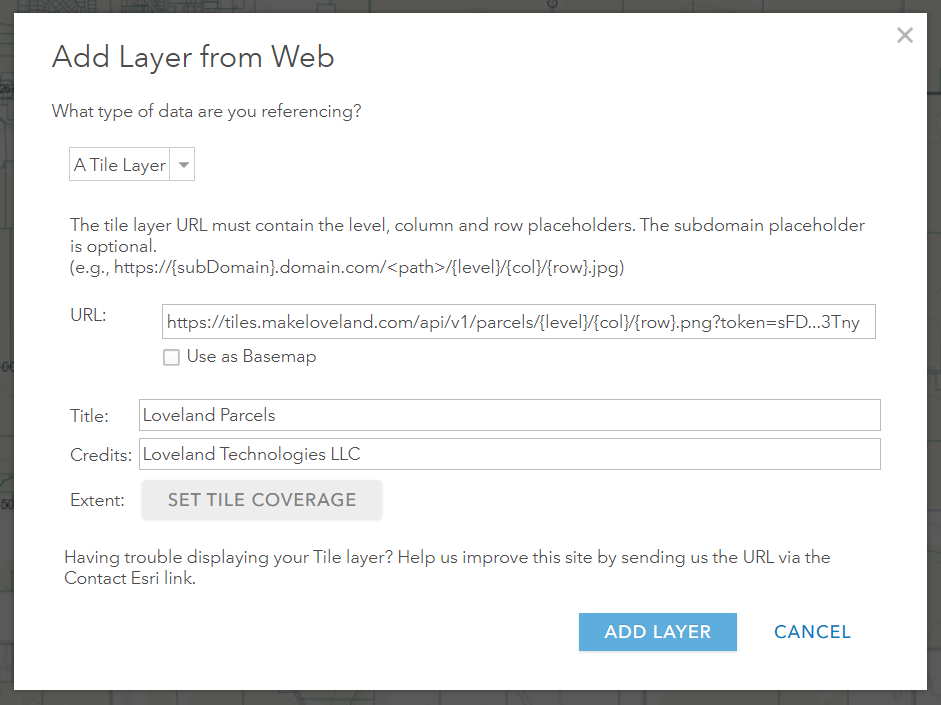
ArcGIS Online (AGOL)
ArcGISOnline TiledLayer works with our raster tile layer, but the {z}/{x}/{y} of our urls needs to be changed to the literal text string that looks like this: {level}/{col}/{row}
You literally leave those level, col, and row words in there instead of the z,x,y our TileJson returns in URLs:
AGSWebTiledLayer(urlTemplate: "https://tiles.regrid.com/api/v1/parcels/{level}/{col}/{row}.png?token=
ArcGIS Desktop
ArcGIS Desktop products only support Esri based vector tile layers. However, ArcGIS Desktop users can also use our raster tiles for integrations using the same template as ArcGIS Online:
https://tiles.regrid.com/api/v1/parcels/{level}/{col}/{row}.png?token=
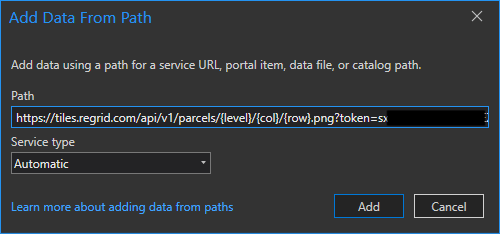
ArcGIS Pro
ArcGIS Pro products only support Esri based vector tile layers. However, ArcGIS Pro users can also use our raster tiles for integrations using the same template as ArcGIS Online:
https://tiles.regrid.com/api/v1/parcels/{level}/{col}/{row}.png?token=
- Navigate to Add Data
- Add Data from Path
- Enter the URL plus adding your token
- Keep layer type as 'Automatic'
Google Maps
Google maps primarily supports raster layers. This snippet uses jQuery to fetch details from the Regrid tileserver, then formats the parcel URL in the format that Google Maps expects.
loadParcelLayer();

// Get the information we need to add a PNG parcel layer to the map
function loadParcelLayer() {
  var parcelCreate = $.ajax({
    url: 'https://tiles.regrid.com/api/v1/parcels?format=png&token=',
    type: 'GET',
    contentType: 'application/json',
    dataType: 'json'
  });
  parcelCreate.fail(function(jqXHR, textStatus, errorThrown) {
    console.log('Error getting parcel layer', jqXHR, textStatus, errorThrown);
  });

  $.when(parcelCreate).then(setupParcels);
}

// Add the parcel data to the Google Map
function setupParcels(layerData) {
  console.log("Got this layer data from Regrid's servers", layerData);

  var imageMapType = new google.maps.ImageMapType({
    getTileUrl: function(coord, zoom) {
      var tileUrl = layerData.tiles[0];
      tileUrl = tileUrl.replace('{z}', zoom);
      tileUrl = tileUrl.replace('{x}', coord.x);
      tileUrl = tileUrl.replace('{y}', coord.y);

      return tileUrl
    },
    tileSize: new google.maps.Size(256, 256)
  });

  map.overlayMapTypes.push(imageMapType);
}
Custom layers
You can create a custom Layer to get tiles with custom display styles and attributes returned. A Layer defines the set of data attributes returned in the vector tiles and line styling for raster tiles.
Customized parcel attributes are only available in the Mapbox Vector Tiles (.mvt) format. Vector maps are styled client-side, so they do not require a custom layer to style unless you need to include custom attributes. Your mapping platform (for example, Mapbox GL or Tangram) will have detailed documentation on how to style data.
Each layer has a unique ID. Each unique set of styles, attributes, and queries defines new layer – you cannot edit existing layers, just create new ones.
Endpoint
All tileserver requests will be to the https://tiles.regrid.com domain, with the paths described below per request.
Vector tile default response attributes
By default, the following attributes are returned as properties when using our vector tiles:
      "properties": {
        "address": "123900 MAPLE AVE",
        "fid": 607301,
        "ogc_fid": 607301,
        "owner": "ROBERT JAMES",
        "parcelnumb": "11191090020000",
        "path": "/us/il/cook/evanston/607301",
        "ll_uuid": "4e23f7dd-556f-4ca0-90f9-7a2c537548cf"
      }
If an attribute has a null value, that attribute will be omitted from the properties.
This primarily affects the address or owner attributes, but could affect any attribute.
How to create a custom layer
The basic order of operations to create a custom layer is:
- POST JSON to
/api/v1/sourcesto define the styles or custom data (vector tiles only) for a new layer. - Read the response that is formatted in TileJSON to get the new layer's url(s).
- Use the urls specified in the response on your map.
Layer creation endpoint
POST /api/v1/sources?token=
Request parameters:
format(optional): The format of tiles you want. Defaults topng. Specifymvtfor Mapbox Vector Tile format tiles.
Request body:
The JSON for a layer definition has these parameters:
query: Set toparcel: trueto select parcel data (basically always used as in example below). If a parcel is stacked, setreturn_stacked:falseto return only the first parcel with identical geometry.fields(option available for vector tiles only): A list of Regrid Parcel Schema attributes to include. By default, vector tiles includeaddress,owner, andpathstyles(option available for raster tiles only): A string of CartoCSS styles (see "composing styles" below). We apply a set of default styles if you don't specify any.
Sample request body:
This layer requests parcels with a custom line color and additional fields:
POST /api/v1/sources?token=
{
  "query": {
    "parcel": true, "return_stacked":false
  },
  "fields": {
    "parcel": ["usecode", "usedesc", "parval", "landval"]
  },
  "styles": "Map { background-color: rgba(0,0,0,0); } #loveland { line-color: #69387a; }"
}
Sample layer request response:
You will get a TileJSON response response that includes:
- a unique layer ID
- the tile URL template for use in slippy maps
- the query, fields and styles you submitted
{
    "tilejson": "2.1.0",
    "id": "e13c4cd22eaf5a751552692075fd04f5c7d741be",
    "maxZoom": 21,
    "tiles": ["https://tiles.regrid.com/api/v1/sources/parcel/layers/e13c4cd22eaf5a751552692075fd04f5c7d741be/{z}/{x}/{y}.png?token="],
    "grids": ["https://tiles.regrid.com/api/v1/sources/parcel/layers/e13c4cd22eaf5a751552692075fd04f5c7d741be/{z}/{x}/{y}.json?token="],
    "vector": ["https://tiles.regrid.com/api/v1/sources/parcel/layers/e13c4cd22eaf5a751552692075fd04f5c7d741be/{z}/{x}/{y}.mvt?token="],
    "query": {
        "parcel": true,
        "operation": "intersection"
    },
    "fields": {
        "parcel": [
            "usecode",
            "usedesc",
            "parval",
            "landval"
        ]
    },
    "styles": "Map { background-color: rgba(0,0,0,0); } #loveland { line-color: #69387a; }"
}
Custom raster map styles
You can style raster tiles (.pngs) by writing CartoCSS styles. Styles should be applied to the #loveland layer.
Some sample styles that illustrate styling based on zoom level:
#loveland {
  line-color: #69387a;
  line-width: 0.25;

  [zoom >= 14] { line-opacity: 0.5; }
  [zoom >= 15] { line-width: 1.5; line-opacity: 1;}
  [zoom >= 17] { line-width: 2.5; }
  [zoom >= 18] { line-width: 3; }
}
You can change the map's background color with Map { background-color: rgba(0,0,0,0); }. That value specifies a transparent background, but you can put in any color.
Leaflet raster layer example
This snippet of code creates a custom layer with red parcel polygons and adds it to a leaflet map:
$.ajax({
  method: 'POST',
  url: 'https://tiles.regrid.com/api/v1/sources?token=...',
  contentType: 'application/json; charset=utf-8',
  dataType: 'json',
  data: JSON.stringify({
    "query": {
      "parcel": true,
    },
    "styles": "Map { background-color: rgba(0,0,0,0); } #loveland { polygon-fill: #FF0000; }",
  }),
}).done(function(data) {
  console.log('Got layer', data);
  L.tileLayer(data.tiles[0]).addTo(map);
});
Matched Building Footprints
If your account is enabled with our Regrid Parcel Data + Matched Building Footprints, you have the ability to create custom raster and vector layers to display the building footprints.
The building footprint tiles contain only the building footprints. You can use the building footprints layer in combination with a parcel layer and the Parcels + Matched Building Footprints API to retrieve additional details, including building attributes.
Sample layer definition with building footprints
To create a building footprints tile layer, follow the steps for creating a custom layer above. In your custom layer definition, specify the buildings layer with a query for "buildings": true.
The default tile format for a custom layer is raster tiles, and you can use the format parameter in the layer request URL to change the default format for the layer to vector tiles.
POST /api/v1/sources?token=
{
  "query": {
    "buildings": true
  },
  "styles": "Map { background-color: rgba(0,0,0,0); } #loveland { line-color: #69387a; }"
}
The styles property above is optional and is be used to style raster tiles.
Standardized Zoning
If your account is enabled with our Standardized Zoning, you have the ability to create custom raster and vector layers to display the zoning areas.
The standardized zoning tiles contain only the zoning information. You can use the standardized zoning layer in combination with a parcel layer and the Parcels + Standardized Zoning API to retrieve additional details, including zoning attributes.
Sample layer definition with standardized zoning
To create a standardized zoning tile layer, follow the steps for creating a custom layer above. In your custom layer definition, specify the zoning layer with a query for "zoning": true.
The default tile format for a custom layer is raster tiles, and you can use the format parameter in the layer request URL to change the default format for the layer to vector tiles.
POST /api/v1/sources?token=
{
  "query": {
    "zoning": true
  },
  fields: {
    "zoning": ["zoning", "zoning_type", "zoning_subtype"]
  },
  "styles": "Map { background-color: rgba(0,0,0,0); } #loveland { line-color: #69387a; }"
}
The styles property above is optional and is be used to style raster tiles.