
Tile layers offer a powerful and flexible tool for creating fast, scalable, and customizable web maps that can be easily integrated into a wide range of web and mobile applications.
A tile layer is a fundamental component of a map style that displays geographic data as a set of tiled images, or “tiles”. A tile layer can include various types of data, including raster and vector data, and it can be customized with different styles, colors, and labels.
The Regrid Tileserver (Parcel Tiles) provides parcel tiles in raster and vector formats for use with web mapping tools like Mapbox GL and Leaflet. This service is available to clients with tiles API subscription. This can also be added on to a Self Serve API Subscription or Enterprise License.
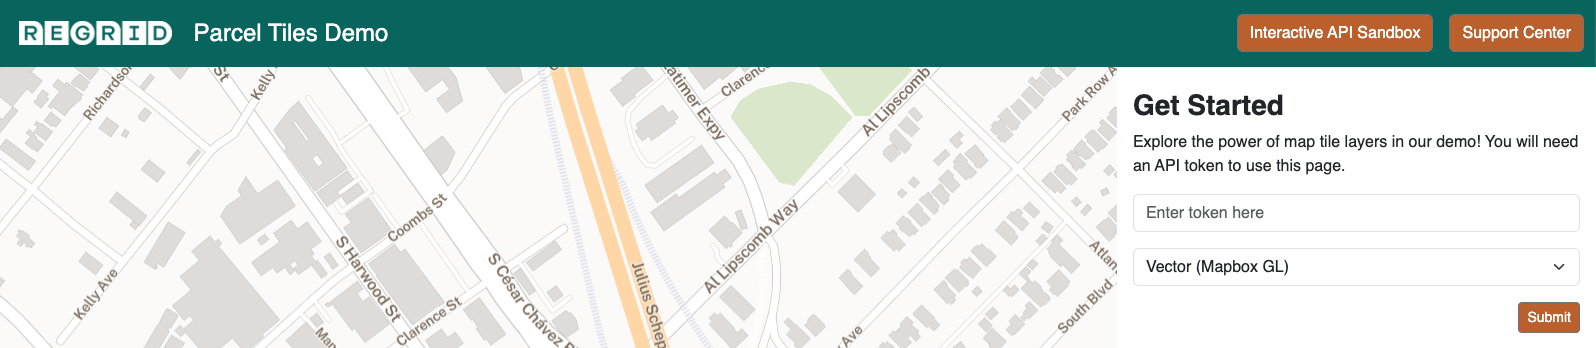
In this demo, you can access vector or raster tiles, see how the usage increments based on using the the map layer and see the returned response. Upon clicking on a parcel and only with vector tiles, you will be able to access a subset of the parcel information.
Learn more about the Parcel Tiles Map Layer (Tileserver)
Need an API token?
You can get a token by signing up for an API Trial token.
If you already have an API trial token, you'll just have to enter the token on the Parcel Tile Demo page.
Mapbox GL Starter Code
To quickly visualize Regrid’s parcel vector tiles on a web map, you can use Mapbox GL JS — a powerful JavaScript library for rendering interactive vector maps in the browser. The following starter code demonstrates how to integrate Regrid’s tile service with a basic Mapbox basemap, overlaying parcel boundaries using Regrid’s vector tiles. This example includes all necessary setup: map container, style reference, tile source configuration, and a parcel layer with simple styling. Replace the placeholders with your own API key and, if needed, customize the basemap or add additional layers to fit your use case.
<!DOCTYPE html>
<html>
<head>
  <meta charset="utf-8" />
  <title>Regrid Tiles in Mapbox GL JS</title>
  <meta name="viewport" content="initial-scale=1,maximum-scale=1,user-scalable=no" />
  <script src="https://api.mapbox.com/mapbox-gl-js/v2.15.0/mapbox-gl.js"></script>
  <link href="https://api.mapbox.com/mapbox-gl-js/v2.15.0/mapbox-gl.css" rel="stylesheet" />
  <style>
    body { margin: 0; padding: 0; }
    #map { position: absolute; top: 0; bottom: 0; width: 100%; }
  </style>
</head>
<body>
<div id="map"></div>
<script>
  mapboxgl.accessToken = 'your-mapbox-token-if-using-mapbox-basemap';
  const map = new mapboxgl.Map({
    container: 'map',
    style: 'mapbox://styles/mapbox/light-v10', // Replace with custom style if preferred
    center: [-83.139981, 42.398763],
    zoom: 15
  });

  map.on('load', () => {
    map.addSource('regrid-parcels', {
      type: 'vector',
      tiles: [
        'https://tiles.regrid.com/api/v1/parcels/{z}/{x}/{y}.mvt?token=YOUR_REGRID_API_KEY'
      ],
      minzoom: 10,
      maxzoom: 22
    });

    map.addLayer({
      id: 'parcel-borders',
      type: 'line',
      source: 'regrid-parcels',
      'source-layer': 'parcels',
      paint: {
        'line-color': '#088',
        'line-width': 1
      }
    });
  });
</script>
</body>
</html>